Overview
The Customer Dashboard provides a secure, authenticated environment for monitoring MCP Server usage and managing your account.
Accessing the Dashboard
URL: https://gn-mcp-dashboard-app.k8s-p.cloud.gracenote.com
Credentials: Provided during onboarding by your Gracenote representative. These are same as your MCP Server credentials.
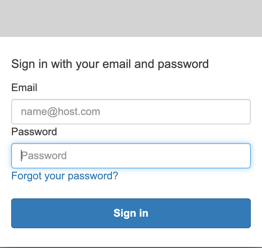
Authentication: Secure login via SSO/Cognito hosted login page.
Using the Dashboard
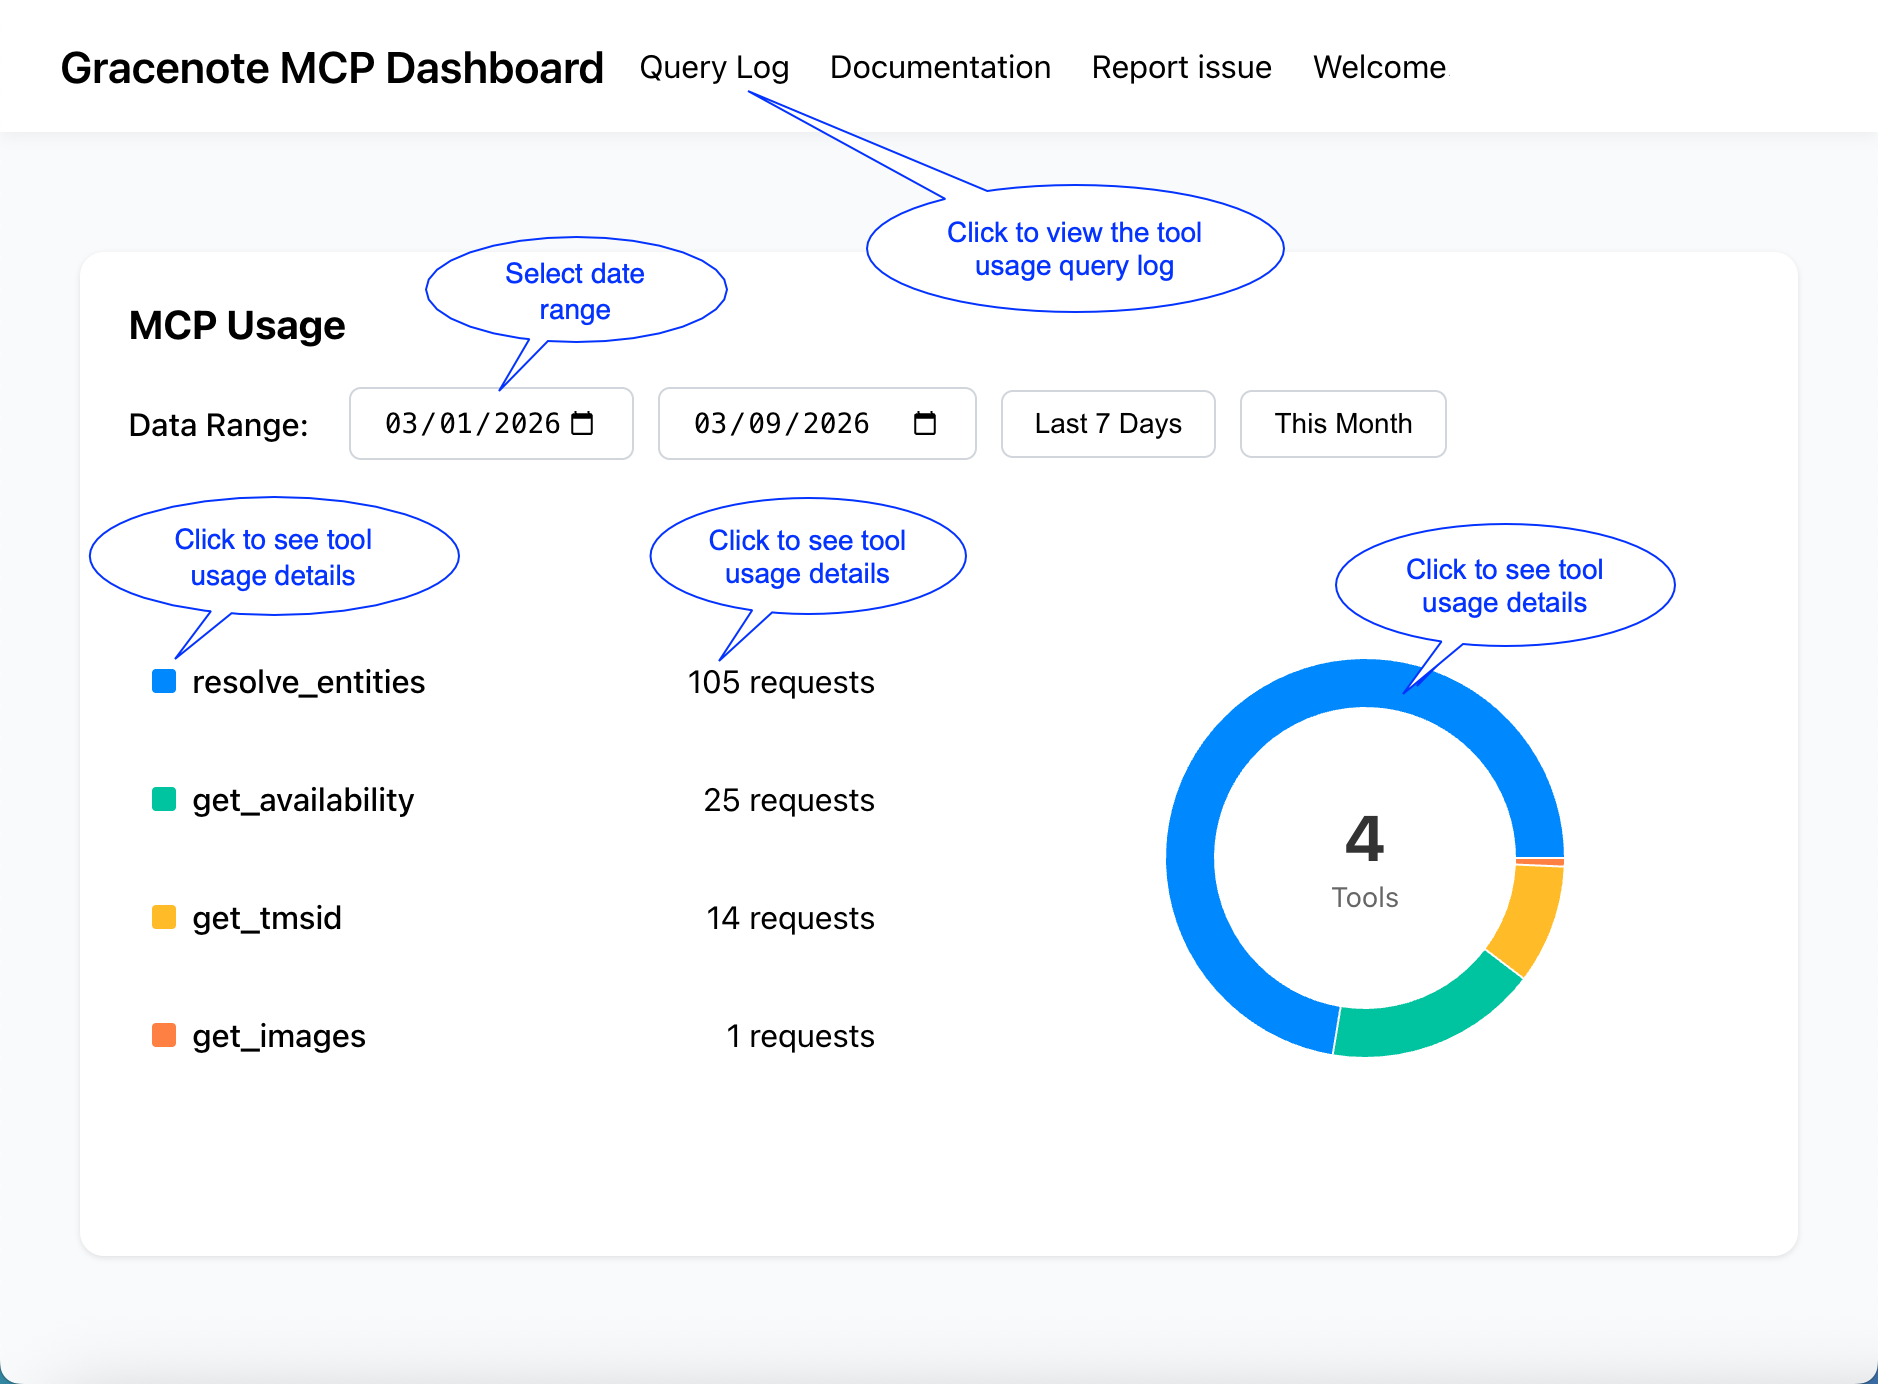
Using the dashboard, you can track your MCP Server usage with based on a date range and by individual tools. This can help you review tool usage over time and identify usage patterns.
- On the dashboard, select a date range.
- View the request summaries for each tool and view the usage distribution chart.
- To view more detail, do one of the following:
- Click the tool name
- Click on the tool's total usage
- Click on the tool's section in the usage chart
- Clock on the Query Log tab
Using the Query Log
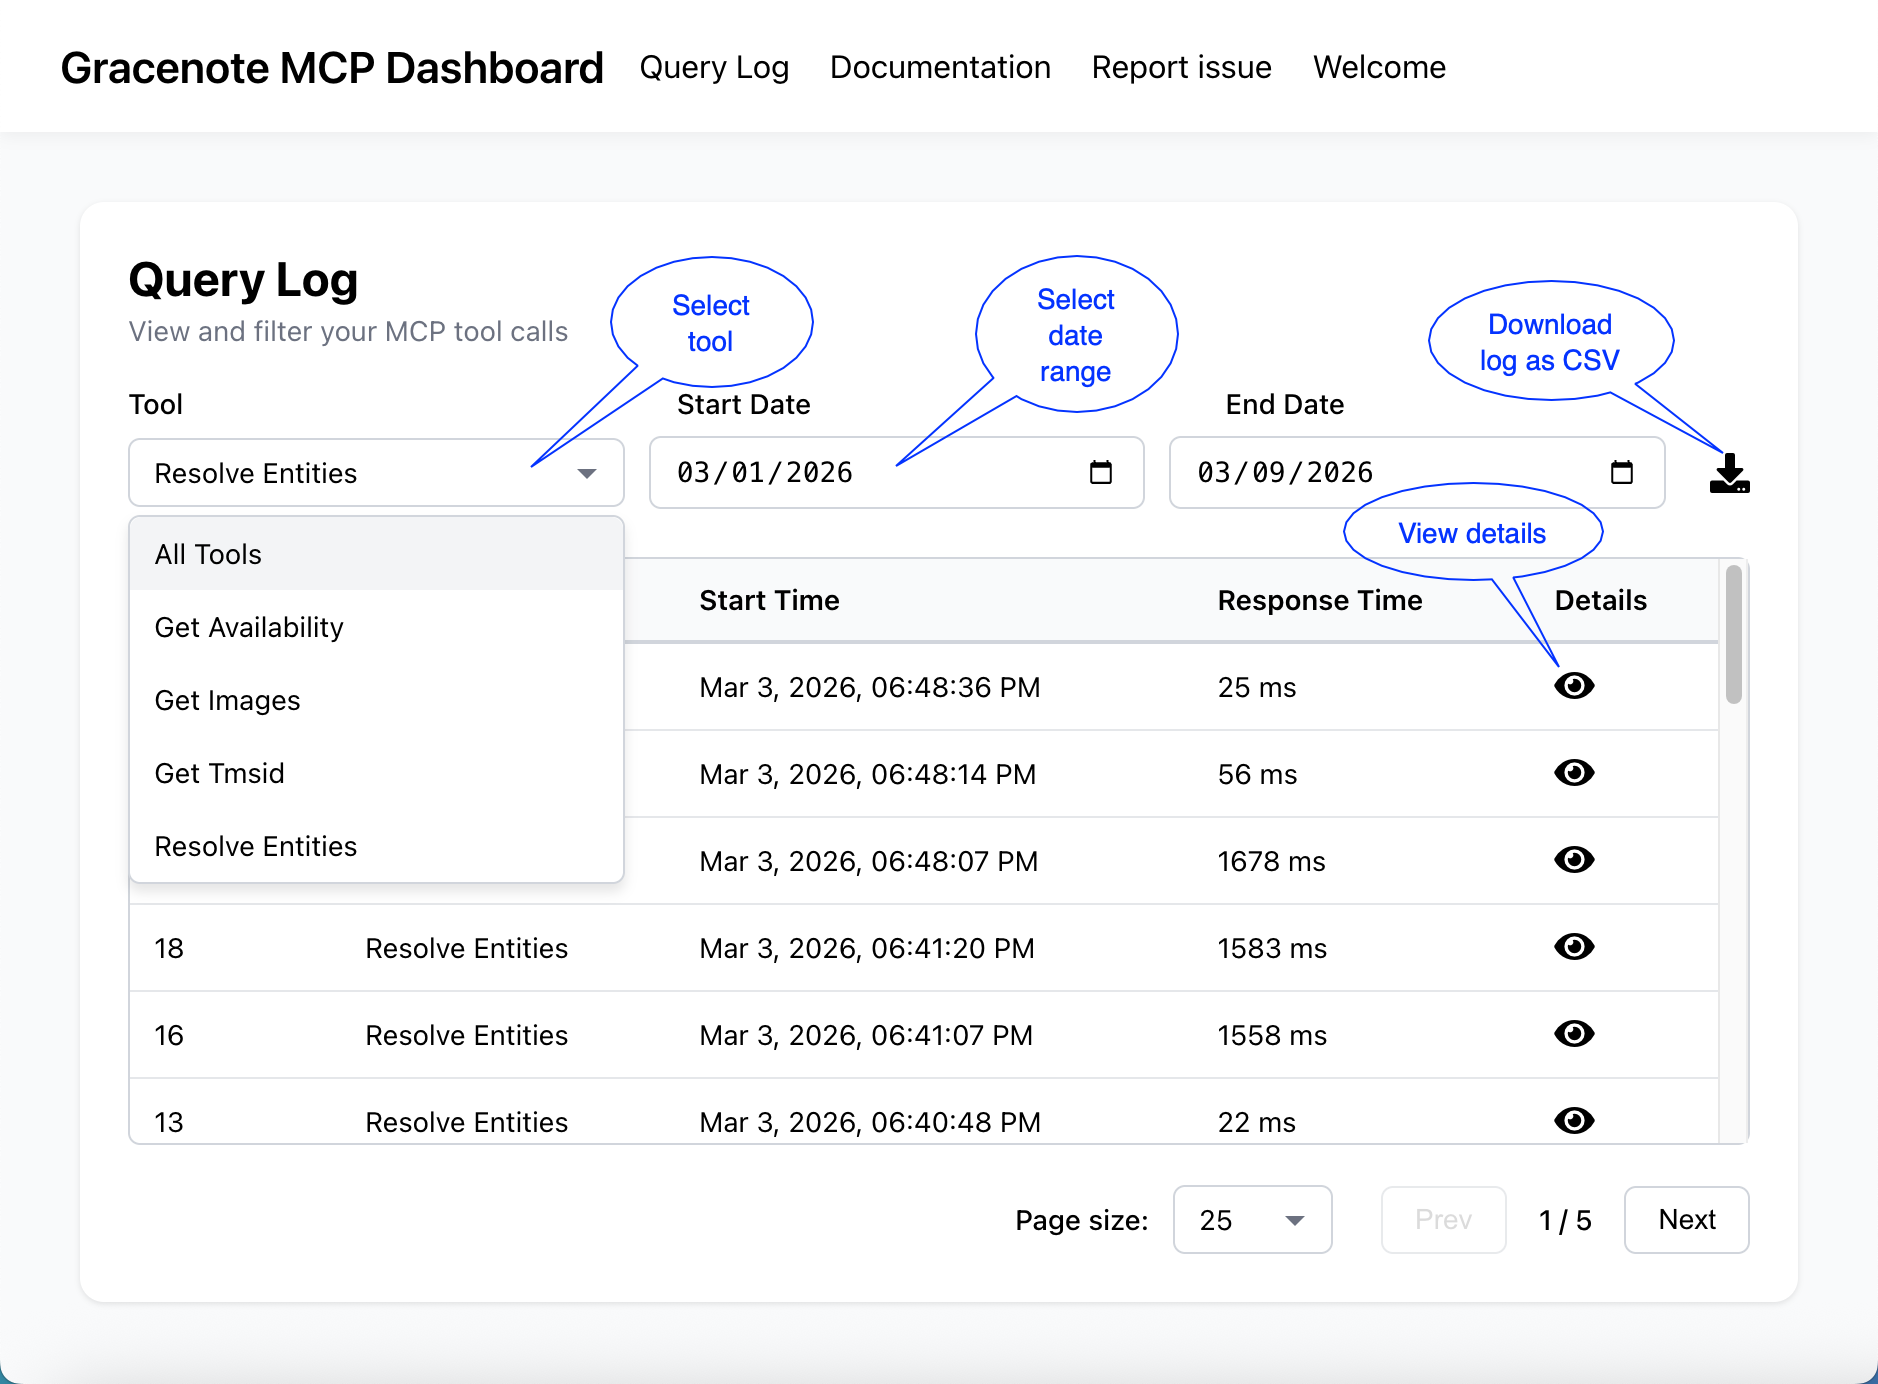
Use the Query Log page to get detailed usage information for MCP tools.
- On the Query Log page, select a date range.
- Use the Tool dropdown to select the tool to view.
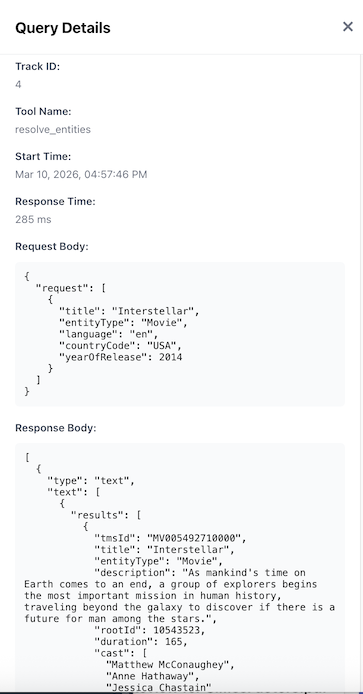
- To view detailed usage data, click the Details view icon. This opens the Query Details page, showing the request body and response for each request.
Data Export
You can export usage data in CSV format for offline analysis.
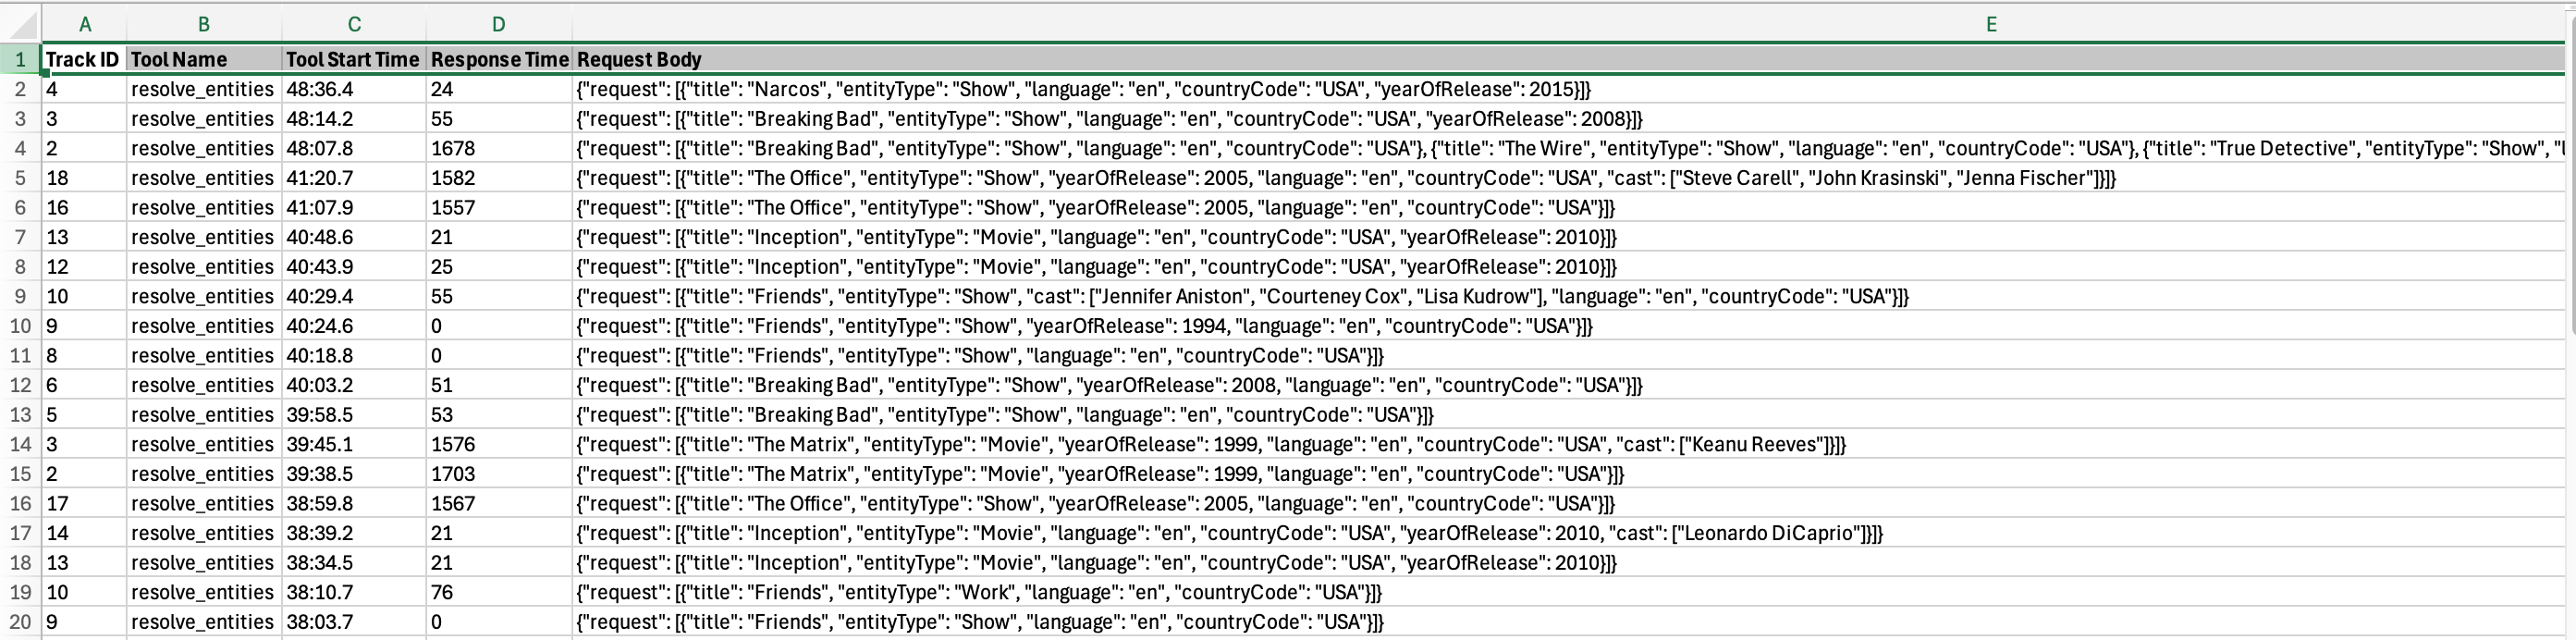
- Select the date range and tool to view, or select All Tools.
- Click the the Query Log download button. This downloads the detailed data CSV file similar to the image below.
Data Currency
Dashboard data is available in near-real time:
- Usage data typically appears within minutes of tool calls
- Export data reflects most recent activity
Best Practices
Regular Monitoring
- Check dashboard weekly to monitor usage trends
- Review monthly invoices promptly
- Track credits consumed vs. annual commitment
Troubleshooting
- Use call details to debug unexpected results
- Filter by date to identify usage spikes
- Export data for detailed analysis
- Attach call details when submitting support tickets
Troubleshooting Dashboard Access
Cannot log in
- Verify credentials with Gracenote representative
- Check for account confirmation status
- Contact support if credentials are lost
Data not appearing
- Check data currency (near-real time, may have slight delay)
- Verify date range filters
- Refresh browser
- Contact support if data is missing
Export not working
- Check date range is valid
- Verify browser allows downloads
- Contact support if issue persists
Security & Privacy
- Dashboard access is authenticated and encrypted
- Only authorized users can access your organization's data
- Usage data is private and not shared with other customers